

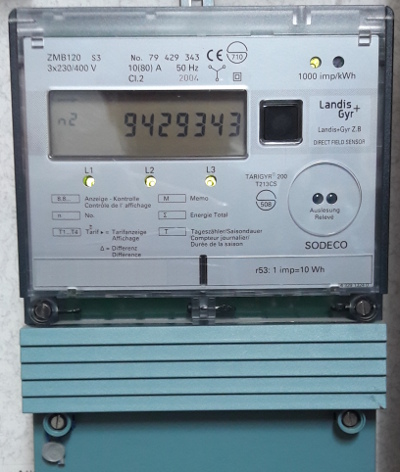
 A Landis+Gyr ZMB120 electricity meter.
 Home | Household | Office | Cooling | Datacentre | Monitoring
This article describes how you go about reading your own electricity meter - provided it is relatively modern, e.g. less than 20 years old and has an IEC62056 interface. This is nothing new, several other projects or pages have described this in a wealth of detail. The majority seem to be in German, so I thought an article in English might be useful too.
 A probe with an RS232/DB9 interface, instead just imagine it with a standard USB 2.0 plug.
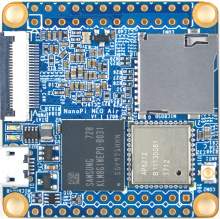
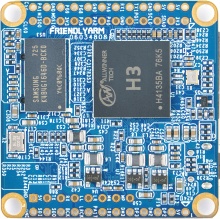 The Nanopi Neo Air. Actual size is 40x40mm, weight 7.5g
In short, this is about running Linux (openSUSE) on a small ARM board (Nanopi Neo Air) with USB-connected IEC62056 infrared readers to access your intelligent electricity meter. Any Linux variation will do as will any machine with a USB interface. I just prefer openSUSE and using a small ARM board seemed like an obvious choice.
In 2016, due to a slowly failing compressor in the cooling plant for our datacentre, we racked up a much larger electricity bill than in previous years. In January 2017, the compressor finally gave up and was replaced, but I was more than a little annoyed it had been going on for so long without anyone noticing.
To avoid such a situation in the future, the obvious solution was to establish some monitoring of our electricity consumption. Manually recording the numbers from the electricity meters was an option, but very tedious. The meters are Landis+Gyr ZMB120 which feature an S0 interface, as well as a DLMS (IEC62056) ditto. The latter is infrared and usually used only once a year when the man comes to read it with a little handheld device. The obvious solution was to read the meter myself.
In 2017 when I looked the prices and availability of such readers (just the infrared attachment), they were about CHF100 which seemed a little too steep. Add that the nearest supplier was in Germany, but did not offer shipping to Switzerland and I discounted that option fairly quickly.
Instead I started looking at using the S0 interface, a green LED producing 1000 impulses per kWh consumed. Using a simple photo transistor, an op-amp and some interfacing circuitry, I started feeding these impulses to a Nanopi Neo Air running openSUSE, where they were recorded and could be read out.
/LGZ4ZMB120T213.103
F(00)
0(      redacted)
1.0(33)
8.1(0050783*kWh)
8.2(0040047*kWh)
8.1.1(0050468*kWh)
8.2.1(0039773*kWh)
8.1.2(0049890*kWh)
8.2.2(0039279*kWh)
8.1.3(0049386*kWh)
8.2.3(0038852*kWh)
8.1.4(0049088*kWh)
8.2.4(0038600*kWh)
8.1.5(0048882*kWh)
8.2.5(0038421*kWh)
8.1.6(0048687*kWh)
8.2.6(0038258*kWh)
8.1.7(0048545*kWh)
8.2.7(0038134*kWh)
8.1.8(0048392*kWh)
8.2.8(0037998*kWh)
8.1.9(0048188*kWh)
8.2.9(0037828*kWh)
8.1.10(0047974*kWh)
8.2.10(0037646*kWh)
8.1.11(0047662*kWh)
8.2.11(0037383*kWh)
8.1.12(0047186*kWh)
8.2.12(0036981*kWh)
8.1.13(0046698*kWh)
8.2.13(0036571*kWh)
8.1.14(0046230*kWh)
8.2.14(0036173*kWh)
8.1.15(0045701*kWh)
8.2.15(0035725*kWh)
8.0(0090830*kWh)
8.0.0(0000000*kWh)
11(12:02:00)
12(19-02-19)
13(___4____)
Sample output from a ZMB120 meter. I have redacted the meter identifier/number.
Version 1 worked really well for about two years, for the single purpose of detecting a change in the trend of electricity consumption. The only issue was - it was a mess. We have four meters, two separate locations with two meters each, plus a bird's nest with bits of electronics, soldered onto a NanoPi. It had been commented on by an electrician as well as the meter reader man.
I wasn't really keen on putting it all into a neat little box, so I kept procrastinating. Then sometime in December 2018, I happened to look up the price of those IEC62056 reading devices again, and they could now be found in China (aliexpress, search for IEC62056) at around SFr40 apiece. I decided to get hold of some, to see how difficult it would be to start reading the meters directly.
The readers arrived from China within a couple of weeks and it didn't take me long to hook one up and start looking at the data available, see sample output to the right. The data is the same that can be read directly on the meter display by cycling through the list, using the black button to the right of the display.
The IR readers are easily hooked up via USB, and present themselves as serial ports (FTDI USB Serial Device converter).
[Sun Mar  3 11:10:52 2019] usbcore: registered new interface driver usbserial
[Sun Mar  3 11:10:52 2019] usbcore: registered new interface driver usbserial_generic
[Sun Mar  3 11:10:52 2019] usbserial: USB Serial support registered for generic
[Sun Mar  3 11:10:52 2019] usbcore: registered new interface driver ftdi_sio
[Sun Mar  3 11:10:52 2019] usbserial: USB Serial support registered for FTDI USB Serial Device
[Sun Mar  3 11:10:52 2019] ftdi_sio 7-1:1.0: FTDI USB Serial Device converter detected
[Sun Mar  3 11:10:52 2019] usb 7-1: Detected FT-X
[Sun Mar  3 11:10:52 2019] usb 7-1: FTDI USB Serial Device converter now attached to ttyUSB0
[Sun Mar  3 11:10:52 2019] ftdi_sio 8-1:1.0: FTDI USB Serial Device converter detected
[Sun Mar  3 11:10:52 2019] usb 8-1: Detected FT-X
[Sun Mar  3 11:10:52 2019] usb 8-1: FTDI USB Serial Device converter now attached to ttyUSB1
Some dmesg output from one of the Nano Pis.
As you can see, there is quite a bit of data, the counter block has 32 entries. The numbers on the left are OBIS identifiers. I have not looked into what they all mean, really only 8.0, 8.1 and 8.2:
8.1 = kwh consumed, daytime tariff
8.2 = kwh consumed, nighttime tariff
8.0 = kwh consumed, total.
Each Nanopi has two readers attached, one for each meter. The reader "head" has a neodyme magnet which makes it easy to attach it to the meter interface.
I read the meters once an hour, and write the results to an RRD database. The meter seems to only speak 300baud which is a little odd, but it only means it takes about 30 seconds to read a full datablock. Apparently, it should be possible to instruct the meter to go higher (the '4' in the meter identification string means 4800baud), but I have been unable to make it work.
Once the data is in the RRD database, it is easy to draw charts, compute trends etc. As I wrote earlier, my main purpose is to spot a change in trends, so I look at the trends for the last week, the last month and the last 6 months. When a trend exceeds a preset threshhold, I generate an alarm.
To put the charts on the website, I proxy requests from the webserver to one of the two Nanopis. Each of those run thttpd, the tiniest webserver, perfect for this job. thttpd in turn runs a cgi script which in turn invokes "rrdtool graph" with a set of suitable arguments.
